

Sewage system management: What the data reveals
Sewage infrastructure is not something most people think about. But for the engineers and operators responsible sewage system management and keeping it running, it is a daily challenge. Pump stations scattered across a municipality, each collecting and pushing wastewater forward through the network, around the clock, in all weather. When something goes wrong — a pump degrading, a sensor drifting, an overflow building — the consequences are real: environmental damage, regulatory risk, and costly emergency interventions.
The people managing these systems are skilled and experienced. But they are also stretched. High workloads and reactive maintenance cycles due to that sensors and pumps are failing silently. And underneath all of this sits a largely untapped resource: years of sensor data from every station in the network. There AI should be able to improve the situation!
At Combine, we have spent the last two years working closely with the SmartWater team from Sweco and several Swedish municipalities to understand what that data actually contains — and what it would take to turn it into something directly useful to the people on the workfloor.
Starting with the data
Our first projects in sewage system management gave us access to data from 41 pump stations across three different municipalities — roughly 7.5 years of historical measurements and around 40 million sensor readings in total. Before any analysis could begin, we needed to understand what we were actually working with.
The answer was: a lot, but not always what you would hope for. Multiple systems and servers held the data, with inconsistent naming conventions, varying sampling rates. In some cases no one who could explain how to extract it. In one project, extracting the data took four months — twice as long as planned — and required a dedicated SCADA expert. Sensors that appeared to be working silently produced repeated values or measured the wrong thing entirely. Only a fraction of the existing signals ended up stored anywhere useful.
This is not unusual. It is, in fact, the norm across the Swedish water and wastewater sector. When we recently participated in a hackathon with the SmartWater team at Sweco and four additional municipalities, the same patterns appeared again: limited overview of the data and operators who wanted better tools, but had no clear path to getting them.
Getting the data infrastructure right is not a technical footnote. It is the foundation everything else depends on. Without high-resolution data stored centrally and consistently, the more advanced analyses simply cannot run.
Across the projects that followed, the number of sensor measurements grew to well over a billion — confirming both the scale of data these networks generate and our ability to handle big data.
What the data reveals
Good sewage system management starts with knowing what your data actually contains. Once the data was accessible and cleaned, the picture that emerged was genuinely interesting. Working with pump current and water level signals — the two measurements available at almost every station — we developed a set of analyses that extract meaningful operational insight from what might otherwise look like noise.
Flow estimation without flow meters
Addresses one of the most persistent gaps in pump station monitoring. Most stations do not have dedicated flow meters, but flow can be estimated with good accuracy from pump run time and known pump characteristics. We call this pump run-time analysis, and it provides a reliable hourly or daily flow estimate that covers all stations in a network — not just the ones with expensive instrumentation.
Pump efficiency tracking
Reveals something operators often sense but cannot easily measure: pumps gradually decline in performance over time. We developed a KPI based on the flow output and the pump runtime. By analyzing this KPI over several months of data, degradation becomes visible as a slow drift in the relationship between the two. This is exactly the kind of signal that enables maintenance to be scheduled based on actual need rather than fixed intervals — reducing both cost and the risk of unexpected failure.

Overflow prediction based on pump run time
Rather than waiting for a overflow sensor to raise the alarm, we monitor how long pumps have been running continuously. As a simple explanation of what principle the models are based on, we can say that if a pump runs for too many minutes in a row, or if multiple pumps run for a long time in a row, we raise an alarm. Tested against historical overflow events across two municipalities, this approach correctly predicted the majority of overflows — in some cases more than nine hours in advance. That window is enough time for an operator to act.
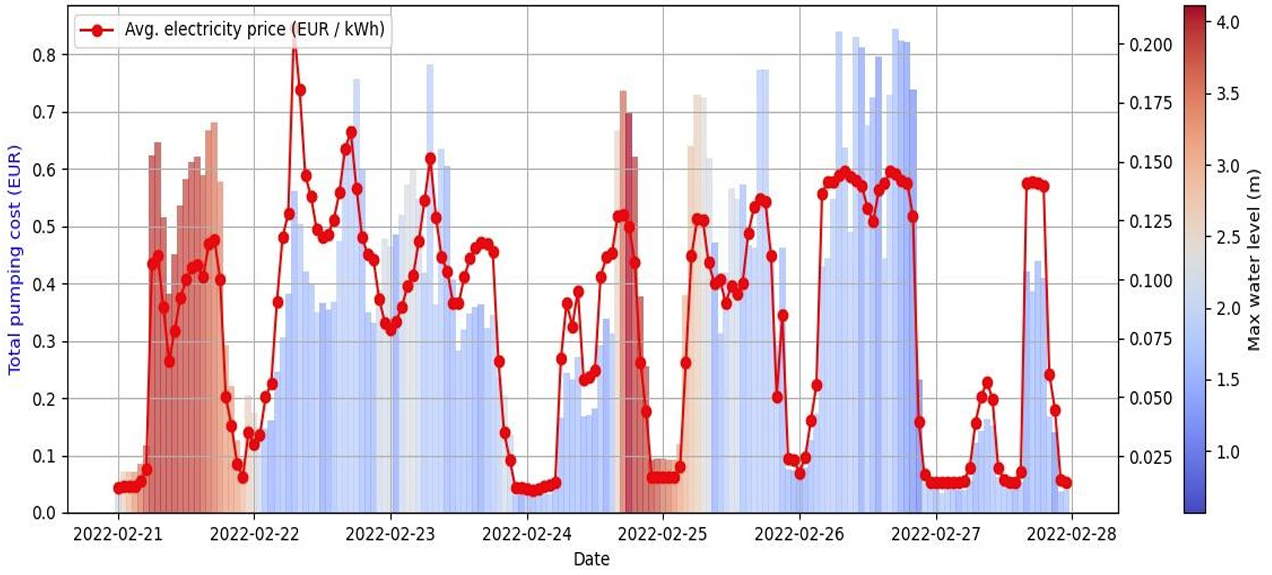
Energy cost optimization
Connects pump operation to electricity pricing. Here we have 2 different leads. The first one is related to the pump efficiency. We see the pump efficiency go down while the energy usage stays the same, meaning that the first energy optimisation can be gained by assuring high pump efficiency. Secondly, since pump stations have some flexibility in when they run — within the constraints of keeping water levels safe — there is real potential to shift pumping toward periods when electricity is cheaper. Visualizing pumping cost alongside spot prices and water levels makes this potential concrete and station-specific.
Data quality monitoring
Runs continuously across all signals and flags anomalies: sensors that have gone silent, stations that have lost contact with the SCADA system, rain gauges that stop registering precipitation even when flow data from nearby stations suggests it is clearly raining. These are problems that currently go undetected for days or weeks. Catching them automatically and immediately changes the maintenance picture entirely.
Rain and flow — knowing what is coming
Rainfall has an immediate and measurable effect on wastewater flow. When it rains, groundwater and surface water find their way into the sewage network through leaking pipes and connections. By correlating historical rainfall data with flow measurements per station, we can quantify how every station responds to precipitation — some see flow increase by as little as 3% per millimetre of rain, others by 11% or more. With that relationship established, weather forecast data can be used to predict expected flow hours or days ahead and flag overflow risk before conditions deteriorate. This turns rainfall from an unpredictable disruption into a manageable variable, giving operators time to prepare rather than react.
Designed to run in real time
A deliberate choice shaped every part of this work: we only developed analyses that could be applied in real time. Not because a real-time deployment was on the table at the time, but because we knew it needed to be on the table eventually — and we did not want to arrive there with methods that could only look backwards.
Underpinning this work is Combine’s combined expertise in control systems and AI, together with Sweco’s expertise in water and wastewater. To build analyses we could trust, we needed to understand the physical behavior of pump stations — not just the data patterns. Digital twin models of individual stations allowed us to simulate how water levels, pump behavior, and flow interact under different conditions, giving us the systems-level insight needed to design methods that hold up in practice, not just in hindsight.
This means the overflow alarm runs from live pump current data, with alarm thresholds that can be tuned per station. The flow estimation updates continuously as pumps cycle. The pump efficiency tracking compares today’s performance against a baseline built from the station’s own history. Everything is designed to run on a live data feed and surface results to an operator without delay.
When an overflow is developing, sensors have broken down or pumps start to lose capacity, an operator needs to know now — not in the next monthly report.
What we learned about the sector
Beyond the technical findings, these projects gave us a clear picture of where the water and wastewater sector actually stands when it comes to data, sewage system management and AI.
The challenges are consistent across organizations. Data is collected but not consolidated. Maintenance is reactive or simply regularly scheduled because there is no early warning. Sensors fail silently. Staff are knowledgeable but overloaded, and organizations have often not yet made the decisions needed to improve their data infrastructure.
At the same time, the potential is significant. The data is there. The signals are real. We can measure the operational improvements. And critically, the people working in these organizations understand what better tools could do for them — they just have not had access to tools that work on their data, at their scale, in real time.
The recent Smartwater hackaton confirmed this most clearly, where engineers and managers from several municipalities worked through exactly these challenges together. The problems are shared. The appetite for solutions is real.
Where this leads
What comes next is putting these capabilities into the hands of the people who need them: a connected, real-time sewage system management application that monitors pump station networks continuously, surfaces the right information at the right moment, and grows more capable as more data flows through it.
We are ready for that step. If your organization manages pump stations and recognizes the challenges described here, we would be glad to show you together with SmartWater/Sweco what this looks like in practice.